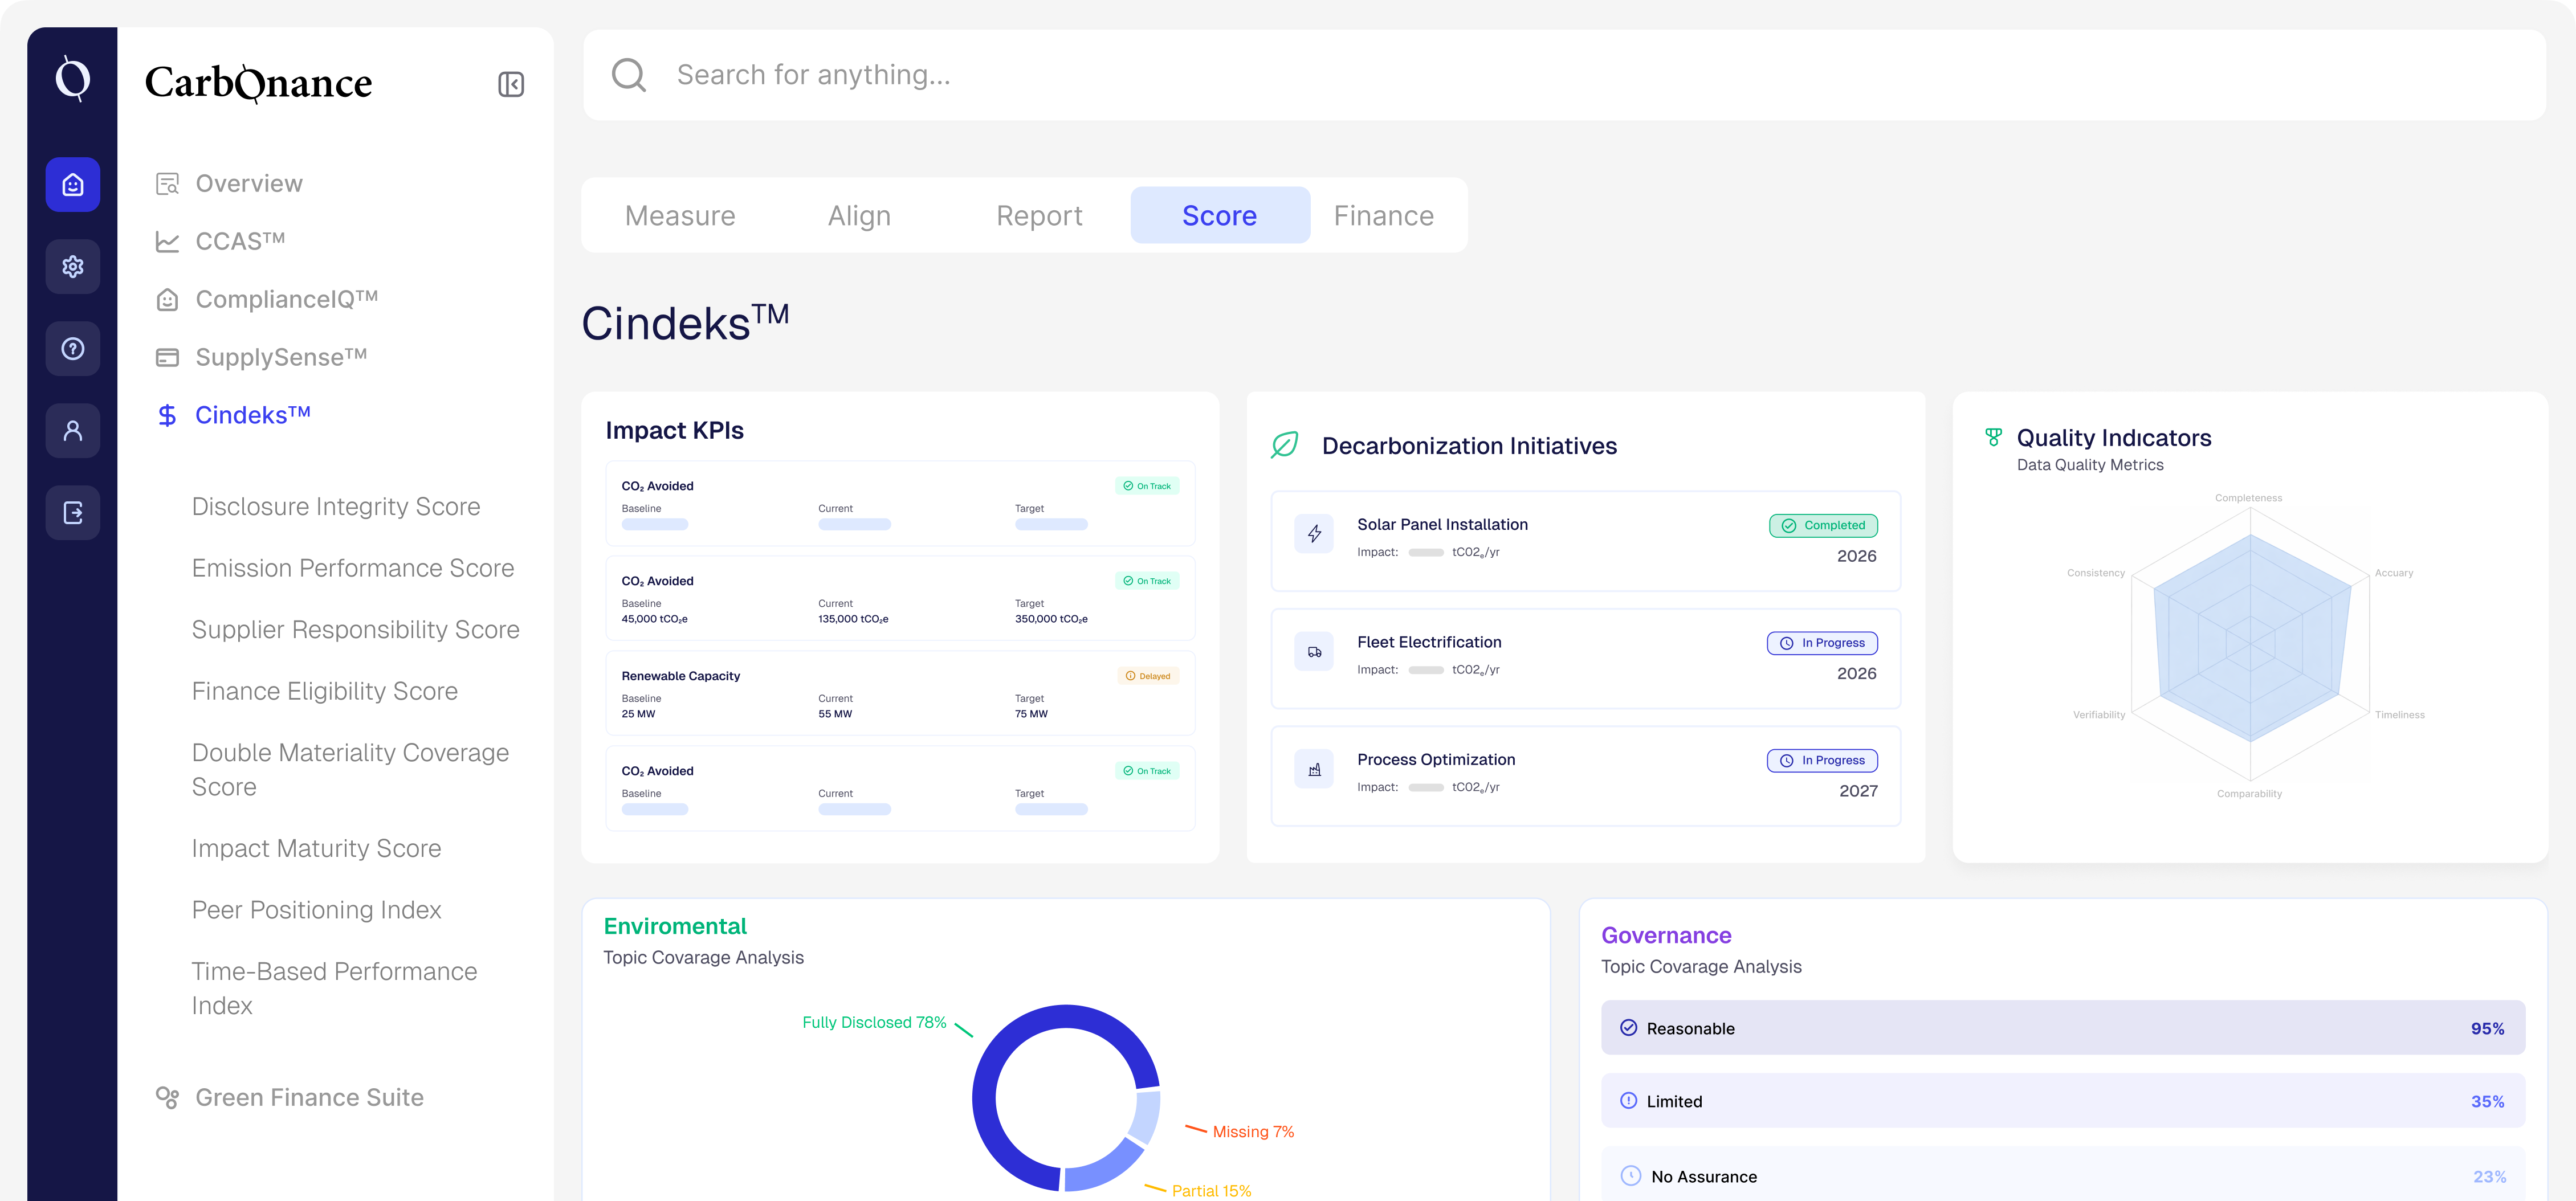

Time-Based Performance Index
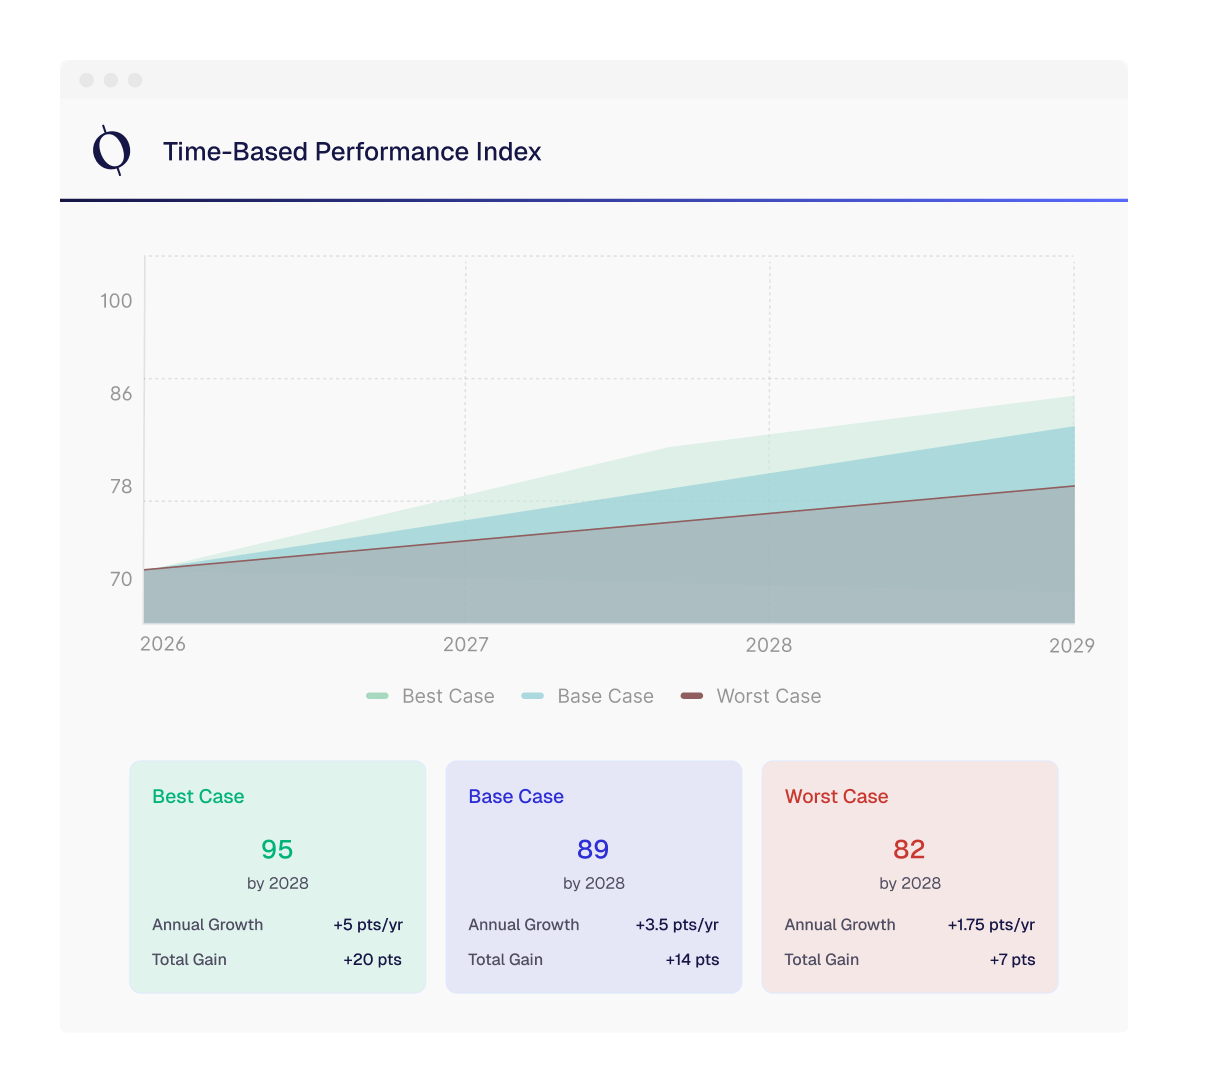

Time-Based Performance Index is the trend indicator within Cindeks™ that shows how all of your scores change over time.
It uses the historical scores of all modules and brings together the change over the last 12 months, the rate of improvement (momentum), the volatility/stability ratio, and negative trend alerts in a single time-based view.



Score History Is Collected
Historical-period values of Cindeks™ sub-scores and indicators are gathered in one place.

Analysis Period Is Defined
The last 12 months are selected by default, but a different date range can be chosen if needed.

Trend and Change Are Calculated
For each score, the direction of change during the selected period (increase/decrease) and the percentage change are calculated.

Improvement Rate and Stability Are Derived
The system shows how quickly scores are changing and how steadily they are progressing, distinguishing stable performance from volatility.

Results View and Alerts Are Generated
A general trend summary is presented, and categories showing a downward trend or sudden deterioration are flagged as alerts.
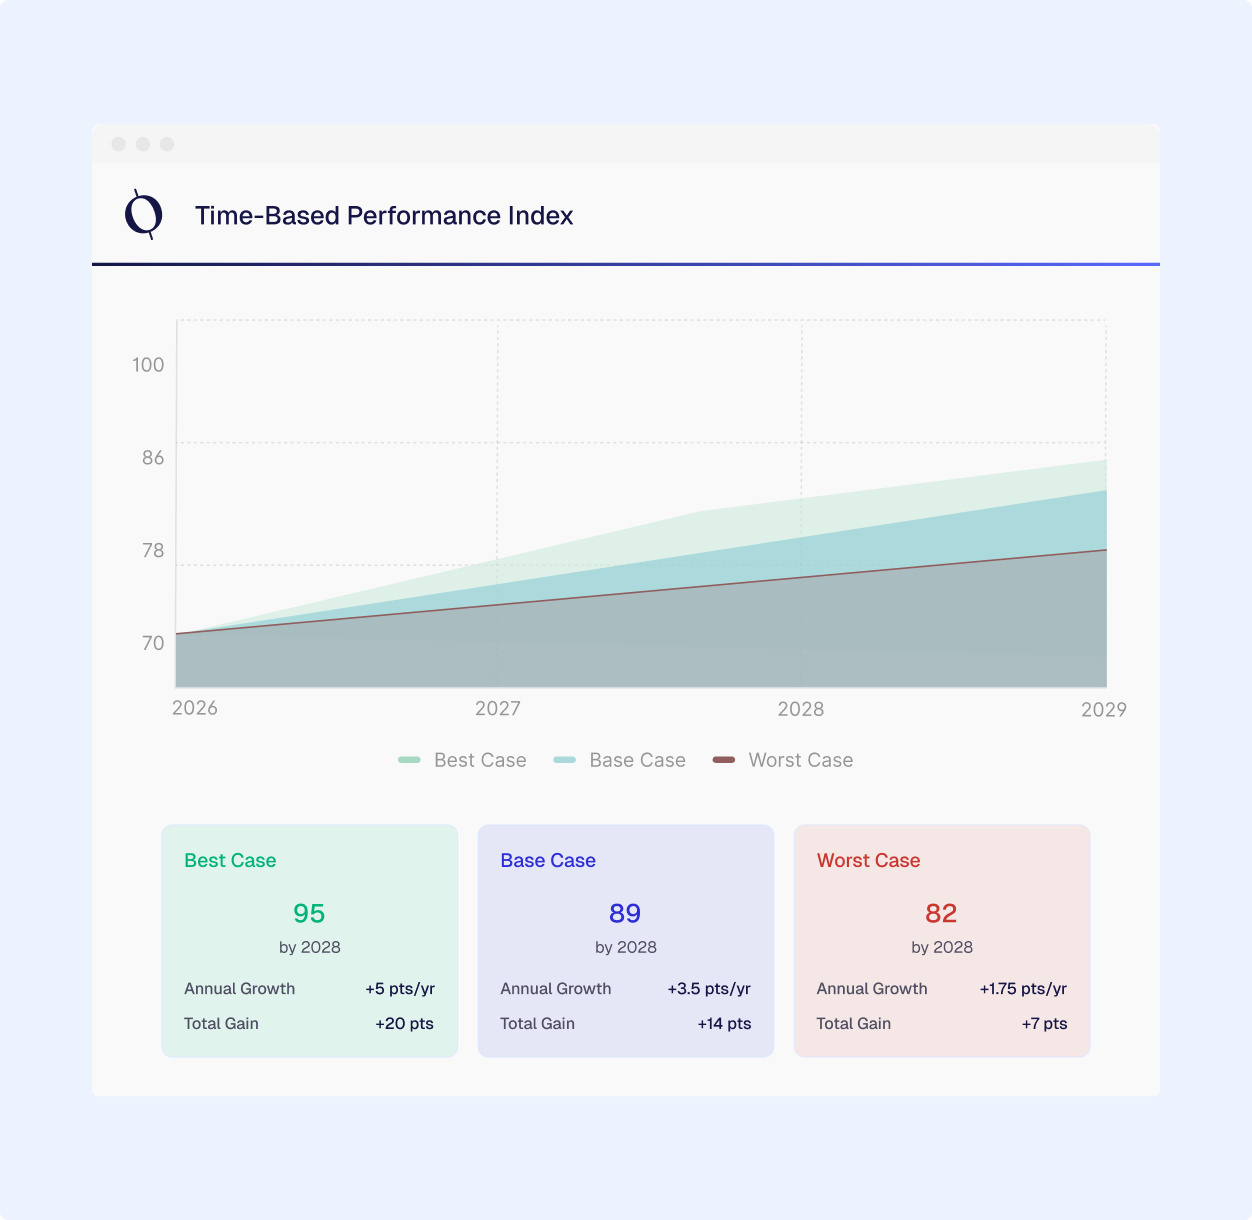
Makes visible not only the current level of scores, but also their direction and trajectory over time.
Clearly shows which areas are progressing quickly and where progress is slowing down.
Distinguishes steady progress from volatile performance and supports more sustainable performance tracking.
Flags scores showing a downward trend or sudden deterioration and makes the need for action visible early.
Presents a clear summary of performance development over time for internal committees, banks, and investor communications.
What does this index show?
It shows how your Cindeks™ scores change over time, including the direction of increase/decrease, the trend, and the overall trajectory.
Which scores does it cover, and where does the data come from?
It uses the historical records of all sub-scores within Cindeks™. Score history sourced from ComplianceIQ™, CCAS™, SupplySense™, and Green Finance Suite™ is evaluated together.
What do I see as an output?
The percentage change over the last 12 months, the rate of improvement, the stability/volatility view, and negative trend alerts are summarized in a single panel.
How should I interpret the results?
An upward and stable trend indicates progress. A downward trend or high volatility points to areas that should be prioritized.
Does this index change Cindeks™ scores?
No. It does not change the scores; it analyzes score history and produces an interpretable trend view.


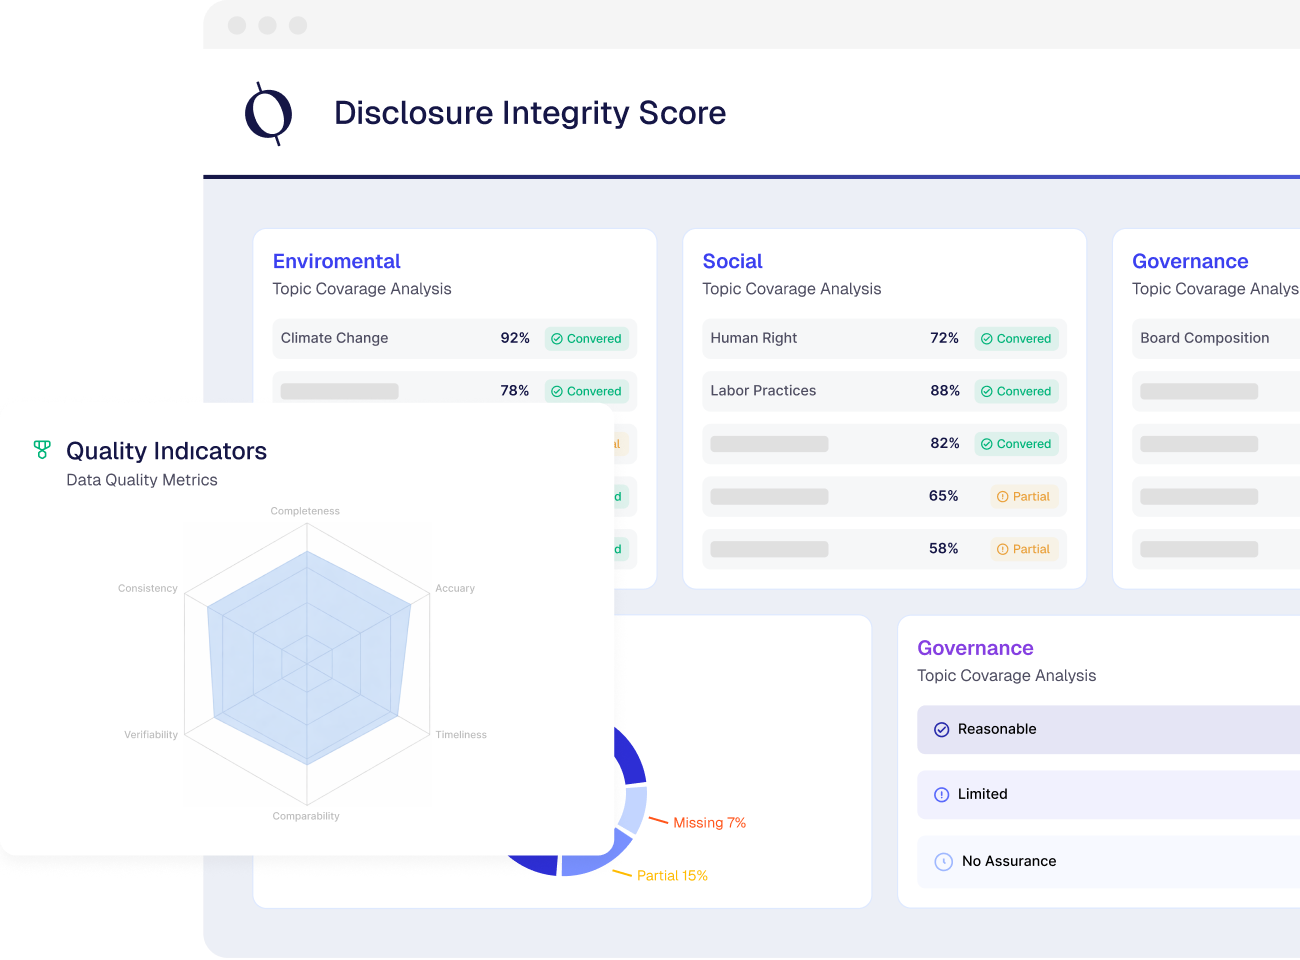
Disclosure Integrity Score
Disclosure Integrity Score is the core Cindeks™ score that measures the quality of your company’s ESG disclosures and its level of alignment with relevant standards.

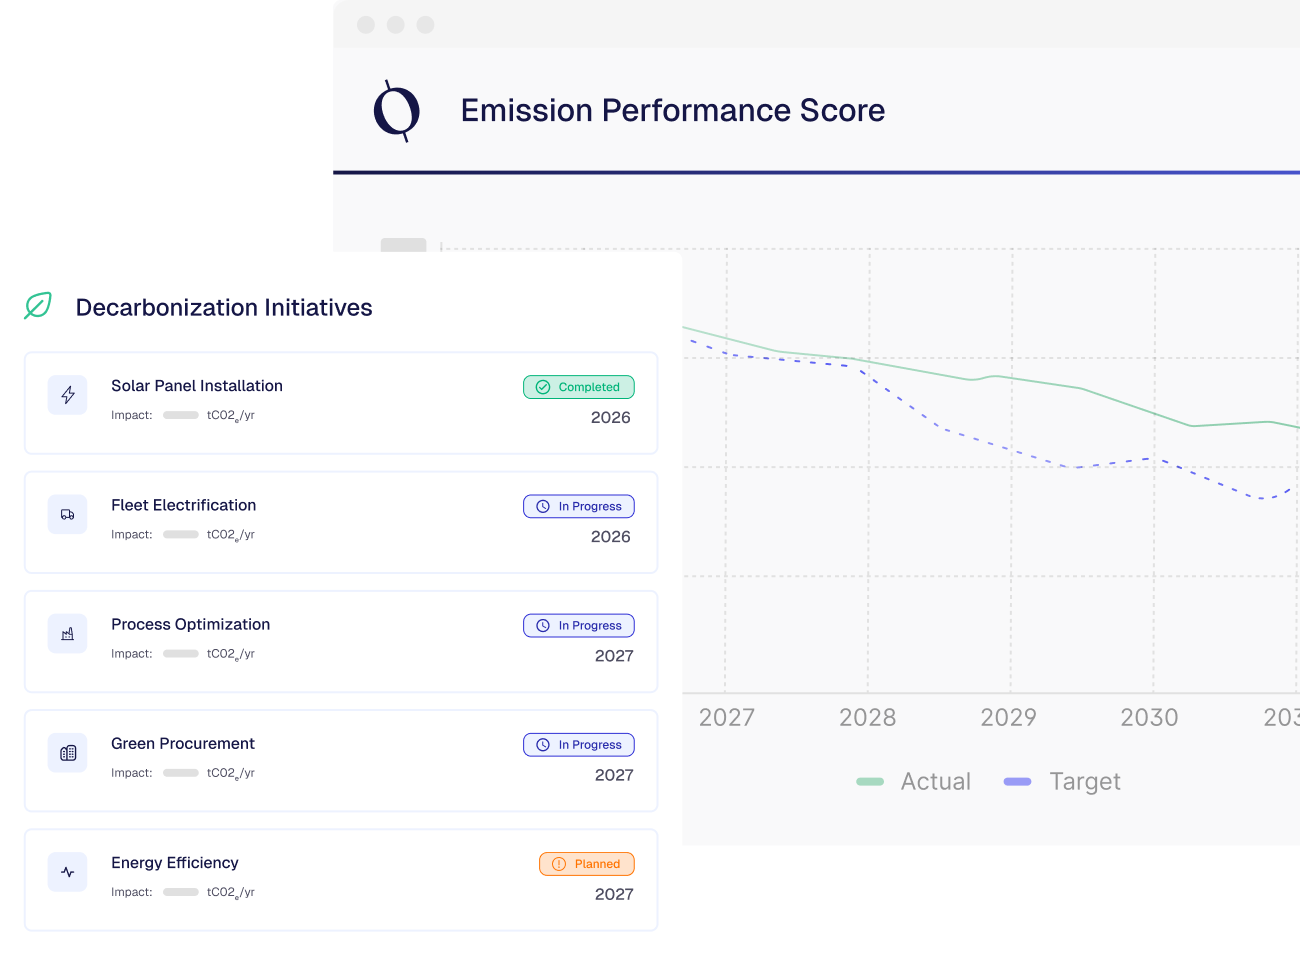
Emission Performance Score
Emission Performance Score is the core Cindeks™ score that reflects your company’s carbon emissions performance and the strength of its emissions reduction strategy.
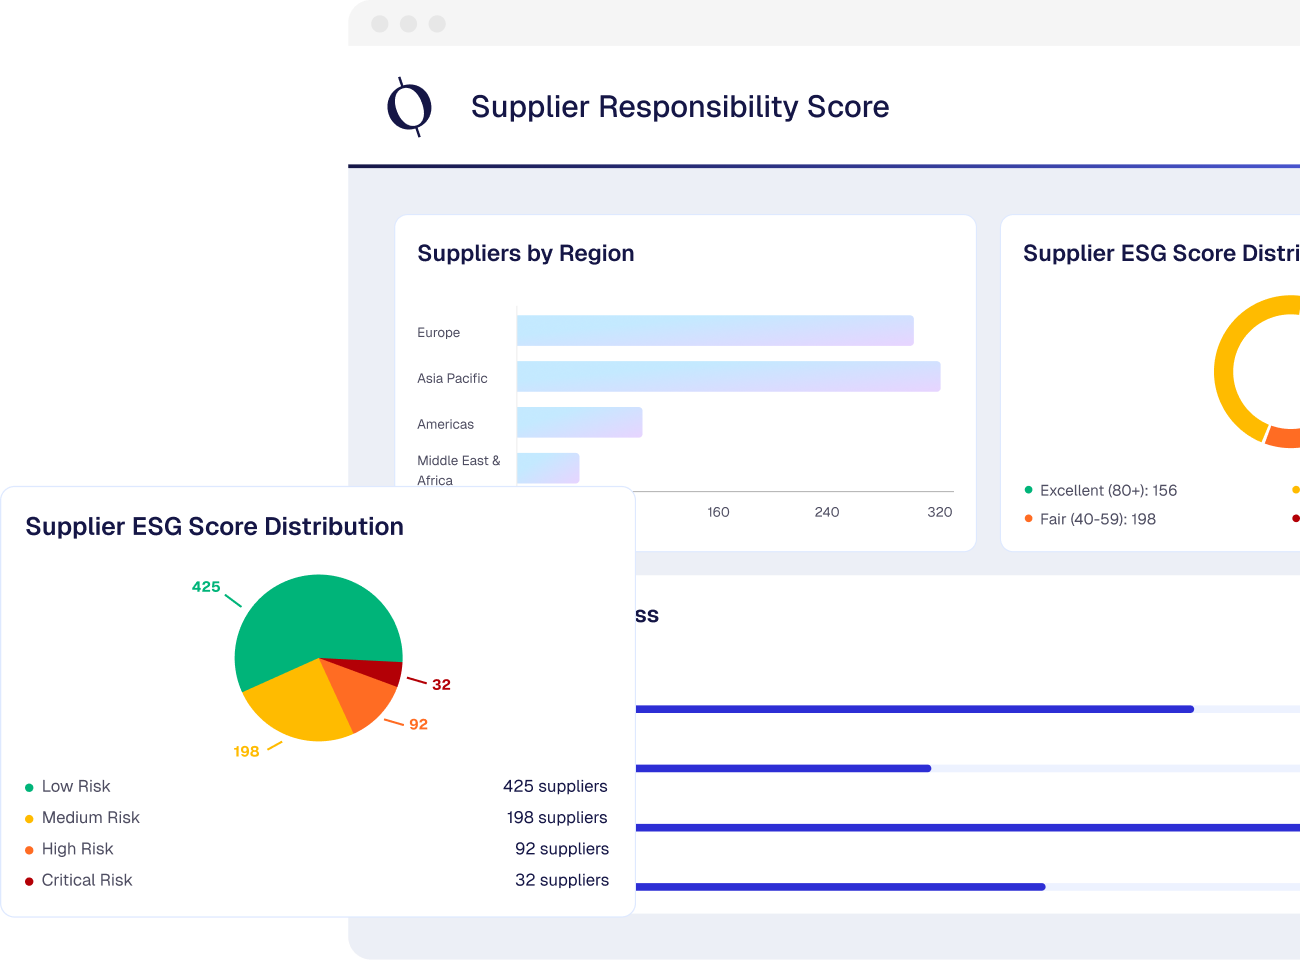
Supplier Responsibility Score
Supplier Responsibility Score is the core Cindeks™ score that reflects your suppliers’ ESG responsibility and level of carbon and data readiness.
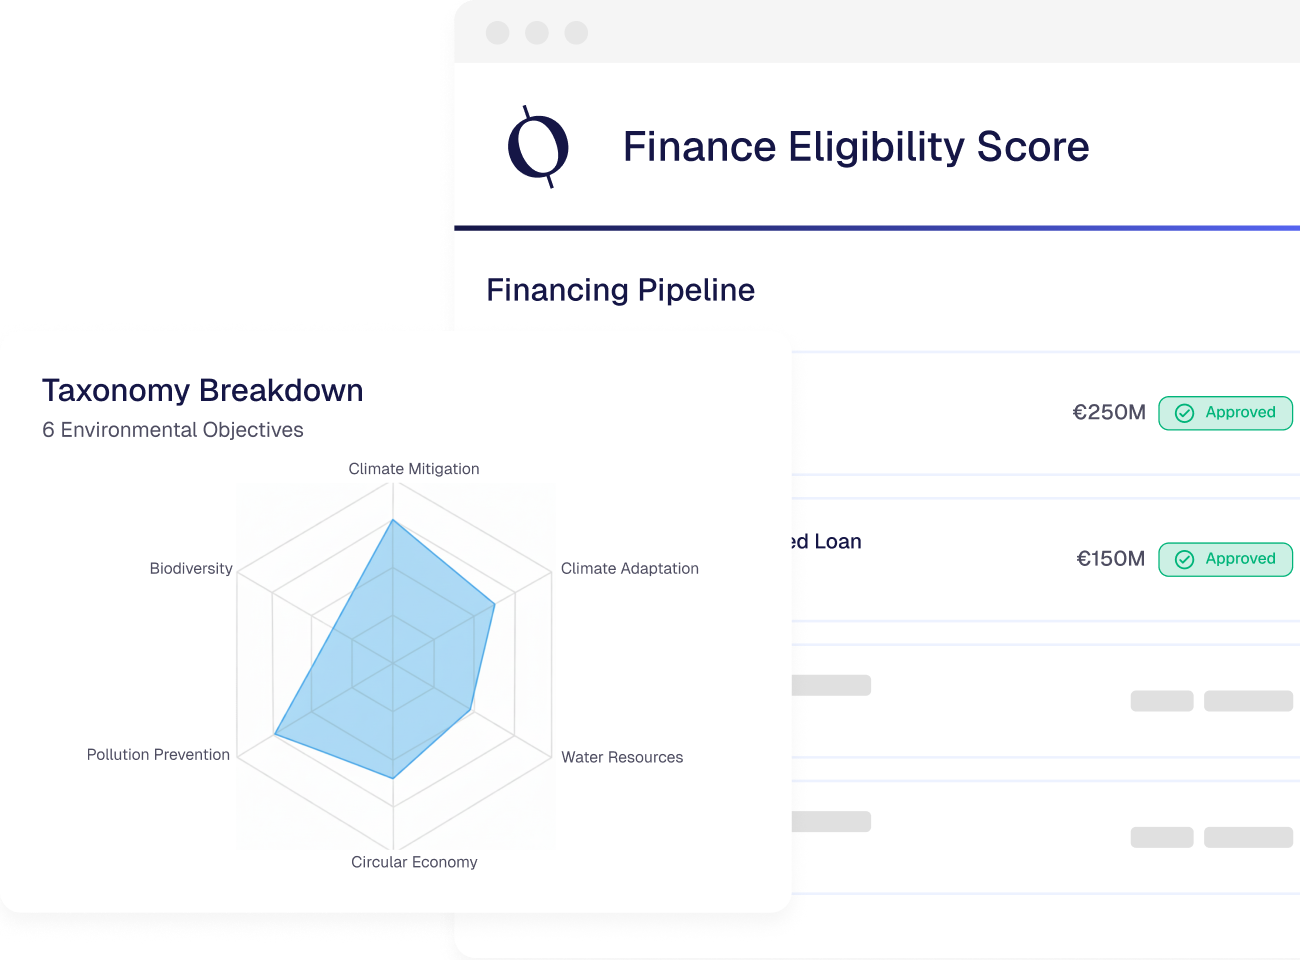
Finance Eligibility Score
Finance Eligibility Score is the core Cindeks™ score that reflects a company’s or project’s eligibility and readiness to access green financing.
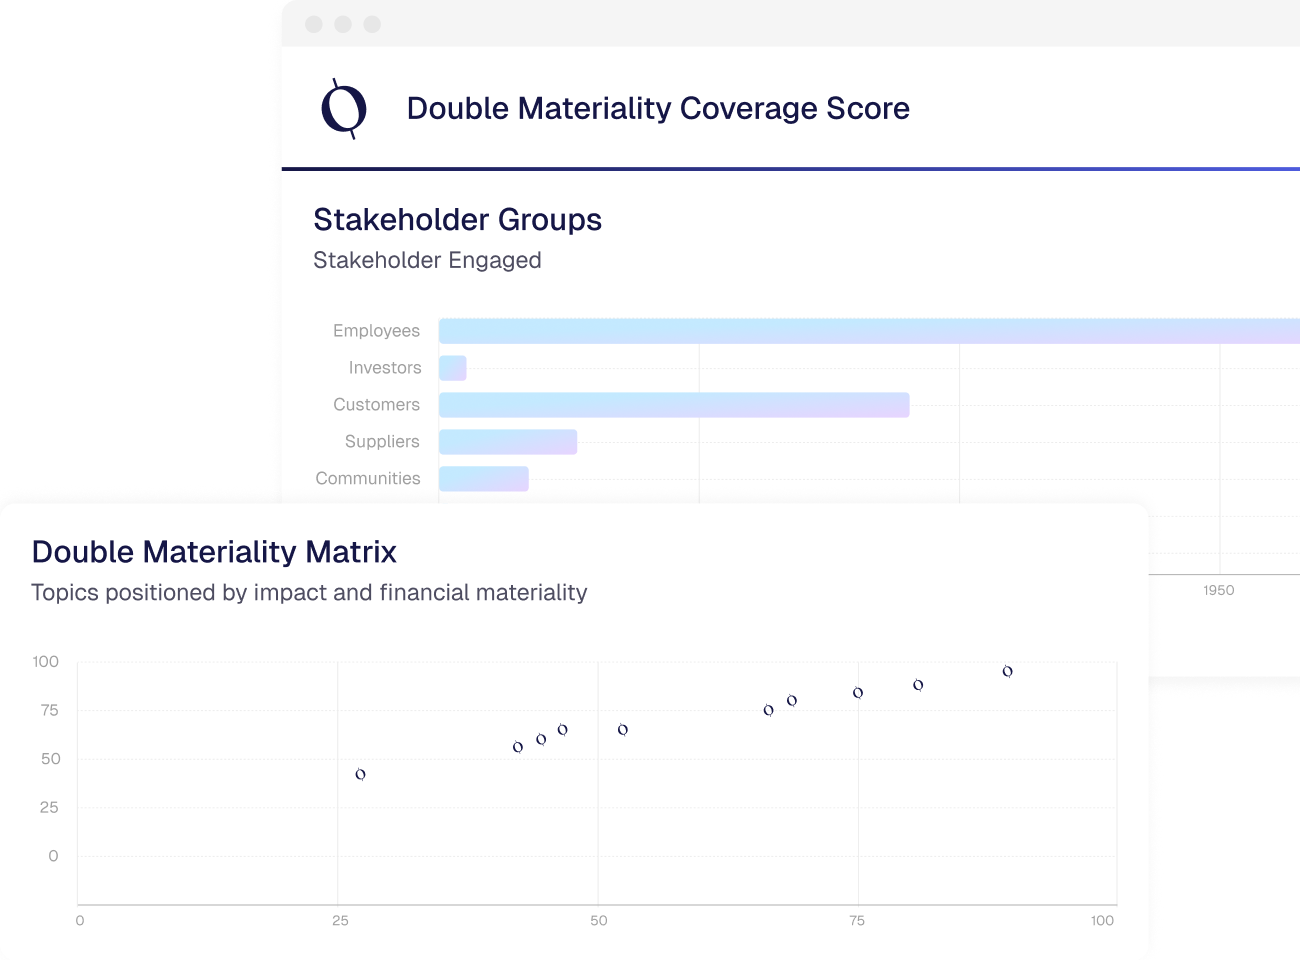
Double Materiality Coverage Score
Double Materiality Coverage Score is Cindeks™'s core score that shows how comprehensively your company conducts its double materiality analysis and how well it complies with ESRS requirements.
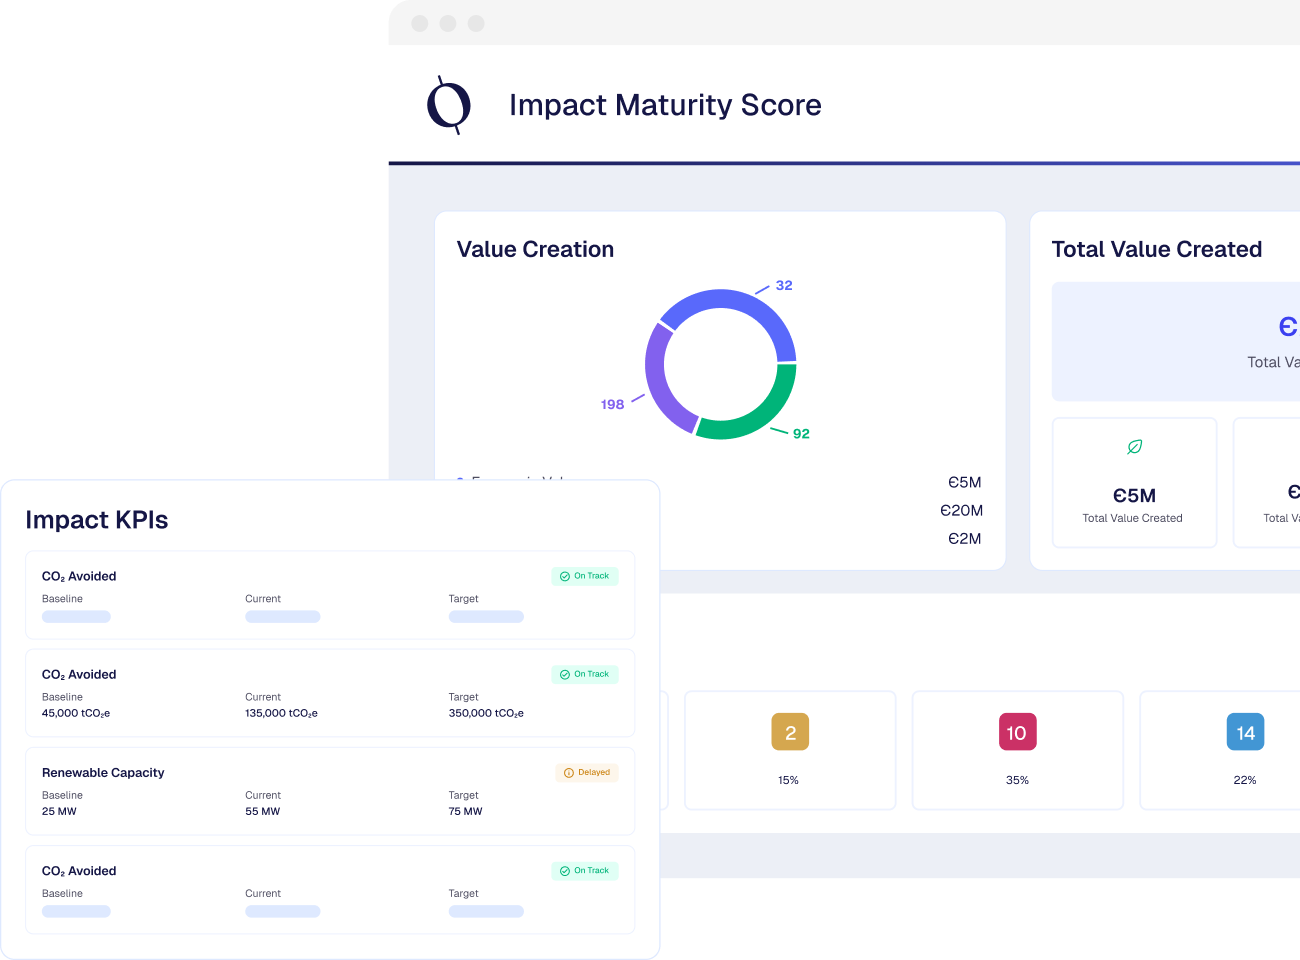
Impact Maturity Score
Impact Maturity Score is Cindeks™'s core score that shows how strongly and measurably a company or project demonstrates its actual sustainability impact.
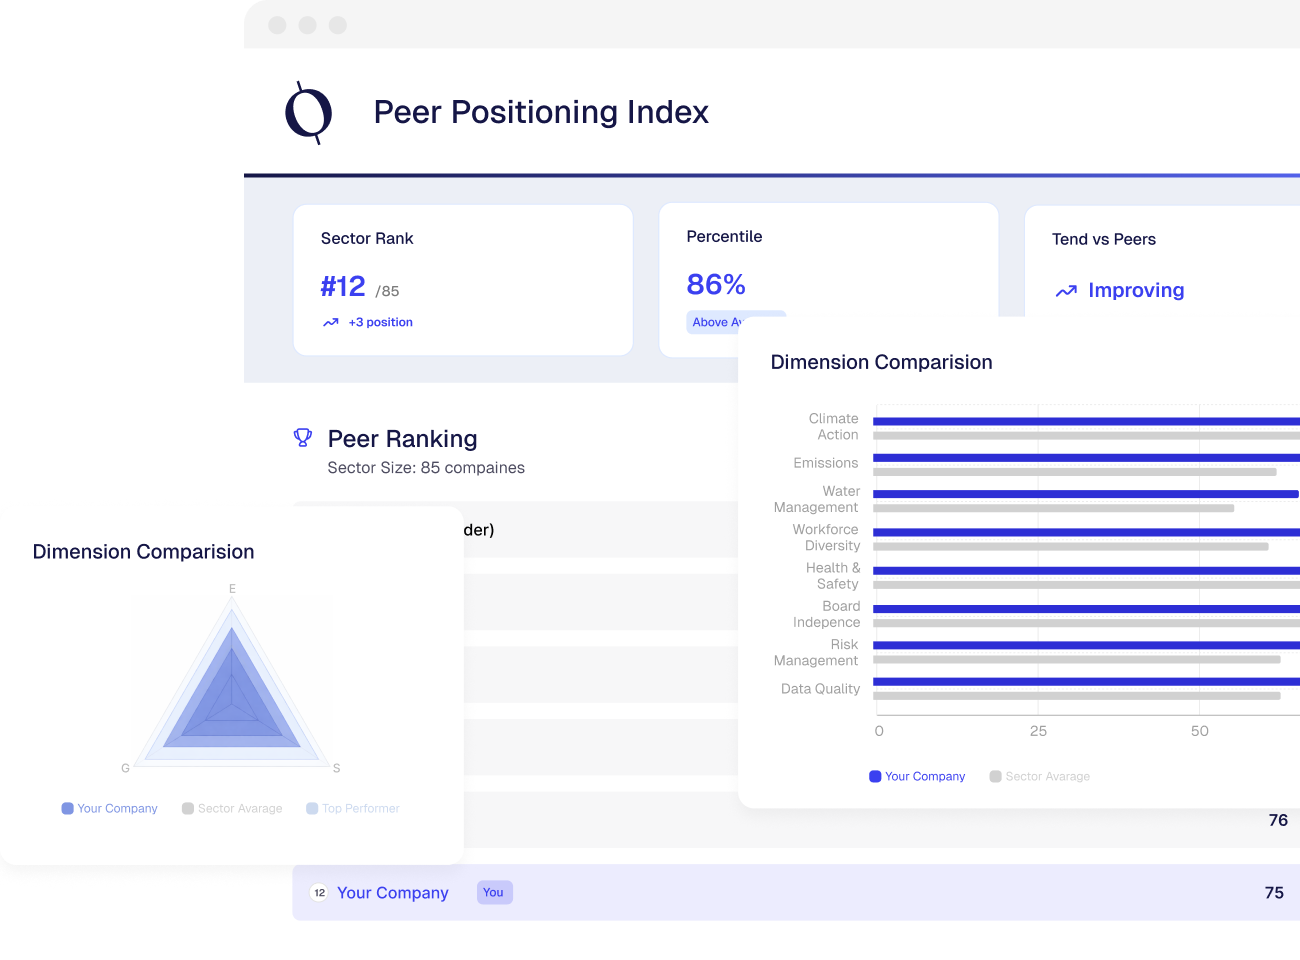
Peer Positioning Index
Peer Positioning Index is a Cindeks™ indicator that shows where your company stands by comparing your Cindeks™ scores with similar companies in your industry.
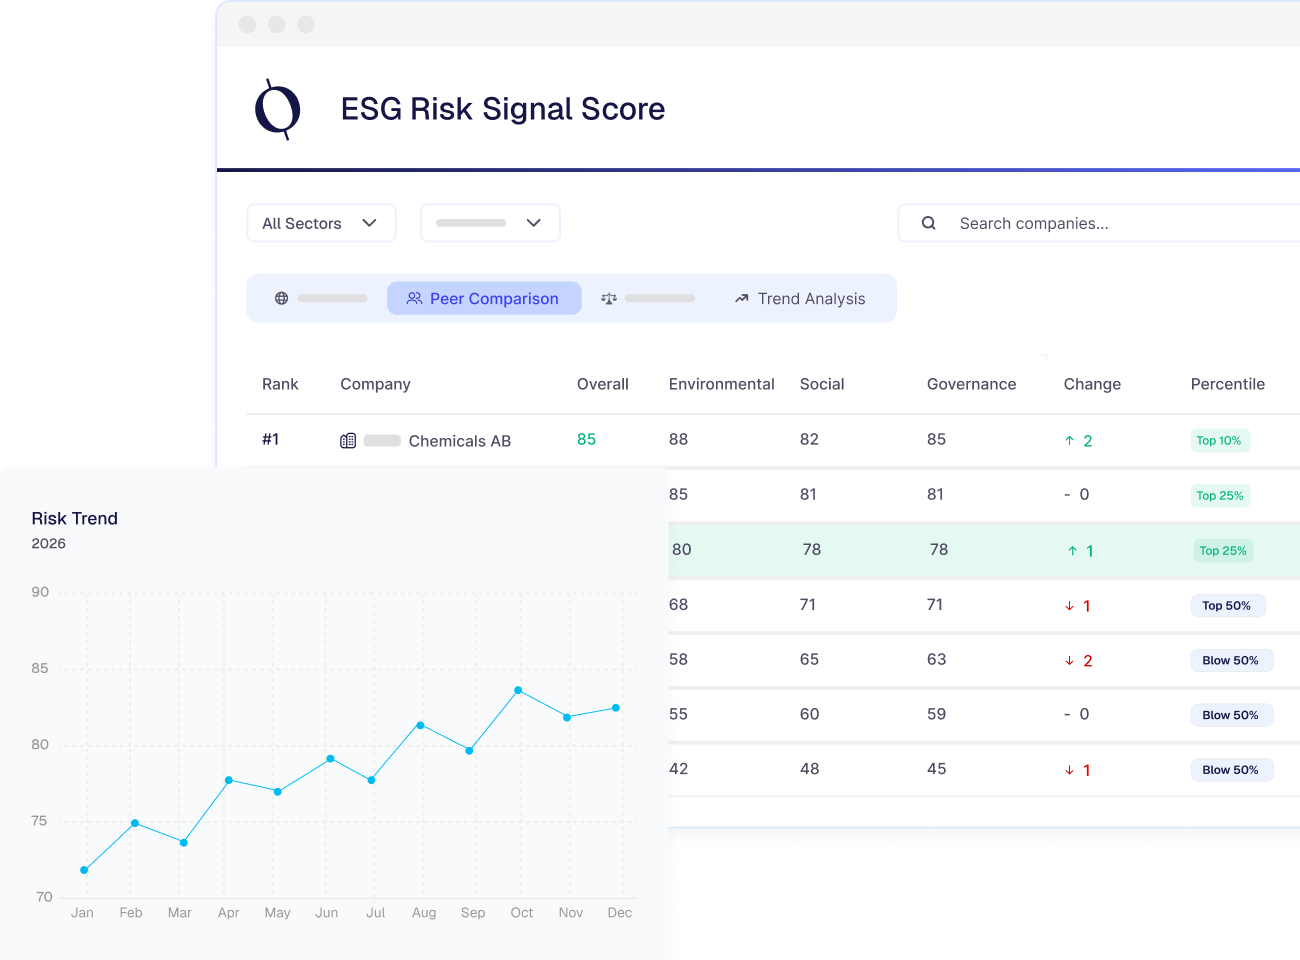
ESG Risk Signal Score
ESG Risk Signal Score is a Cindeks™ score that combines alerts from all products within Carbonance to summarize your company's ESG risk and non-compliance signals in a single indicator.