
Peer Positioning Index
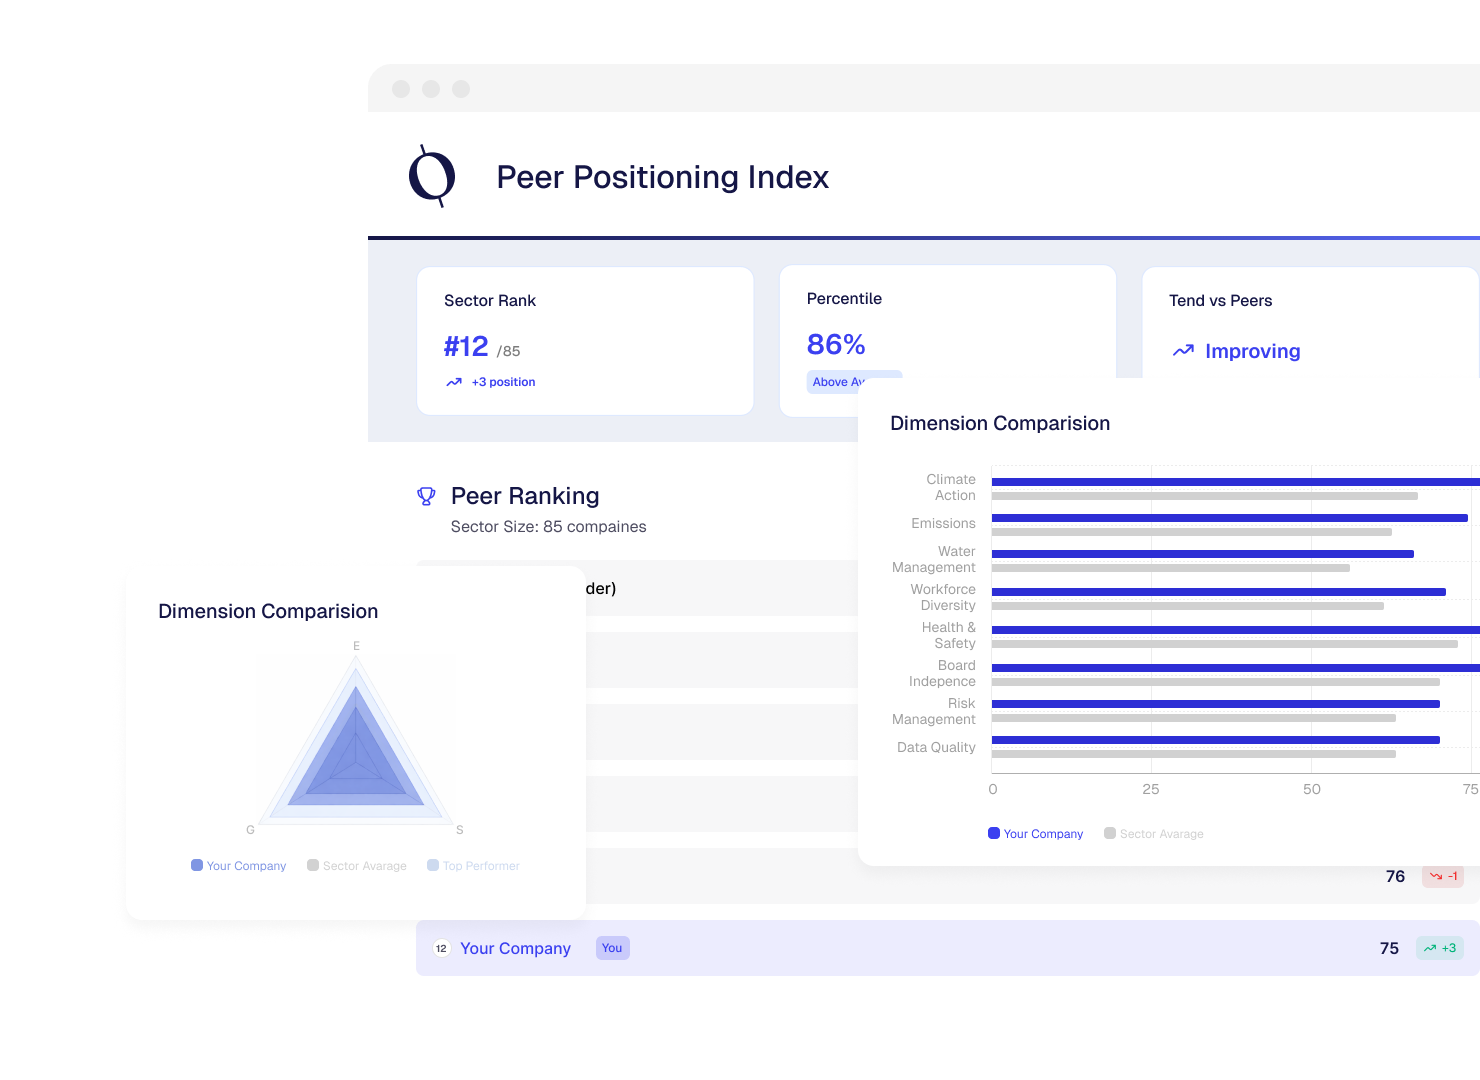

Peer Positioning Index is the Cindeks™ indicator that shows where your company stands by comparing its Cindeks™ scores with similar companies in the sector.
It uses the Cindeks™ benchmark data pool, compares your company with others under the same NACE code, shows your gap versus the sector median, and positions you within the upper tier, middle tier, or lower tier.



Sector and peer group are defined
The sector and comparable company group are defined based on your company’s NACE code and core profile information.

The benchmark dataset is prepared
Relevant score distributions for companies under the same NACE code are drawn from the Cindeks™ benchmark data pool.

Scores are compared
Your company’s Cindeks™ scores are assessed side by side against the sector distribution and the sector median.

Gap analysis is conducted
The system calculates clearly which areas you are ahead in and which areas you are behind in relative to the sector median.

Positioning result is generated
Your percentile position within the sector, such as top 25%, middle, or lower tier, is calculated and summarized on a single screen.
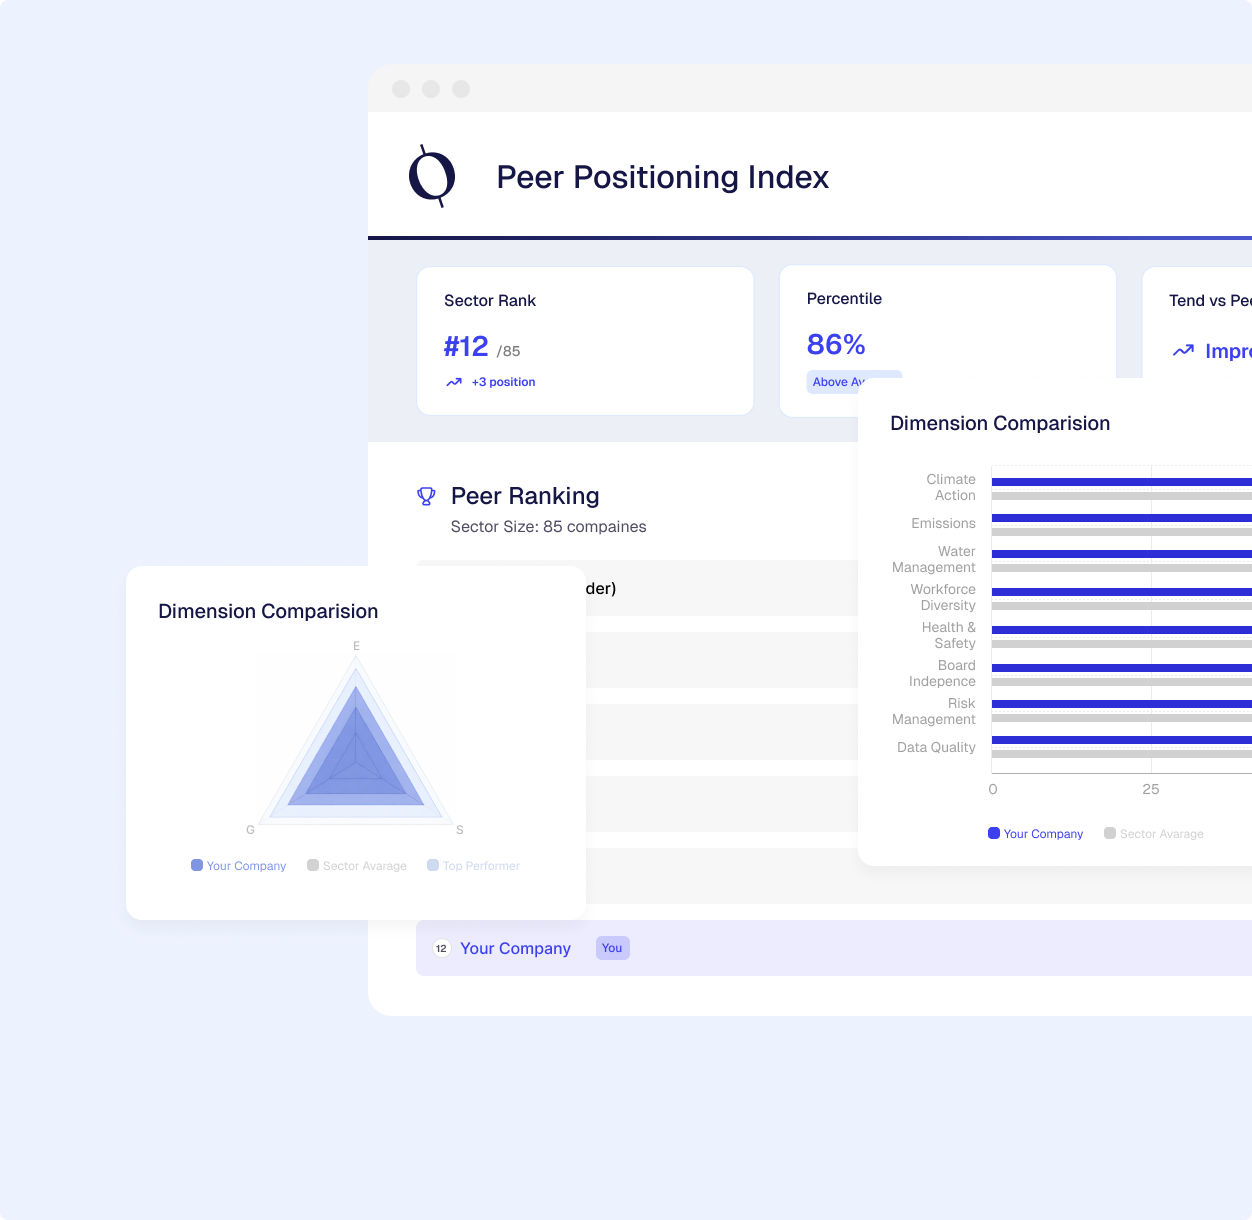
Lets you interpret your scores not in isolation, but alongside similar companies.
Makes visible the areas where you lag behind the sector median and the areas where you stand out.
Clarifies measurable targets such as reaching the sector median or moving into the top 25%, and makes target tracking possible.
Summarizes performance in a peer-comparison structure and in a format suited to decision-making processes.
Brings forward the components that can improve the score in the fastest and most meaningful way, and clarifies which areas should be prioritized.
What does this index show?
It shows the level of your company’s Cindeks scores relative to similar companies in the same sector, together with its percentile position.
Which companies are used for comparison?
Comparison is made against companies under the same NACE code that are included in the benchmark pool.
What do I see as an output?
You see the gap versus the sector median and your percentile position, together with a summary of the areas where you are ahead or behind.
How is this index used in decision processes?
It is used in bank and investor discussions to show the company’s position relative to the sector and to clarify improvement targets.
Does this index change the Cindeks scores themselves?
No. It does not change your Cindeks scores; it positions them within the sector distribution and makes them easier to interpret.


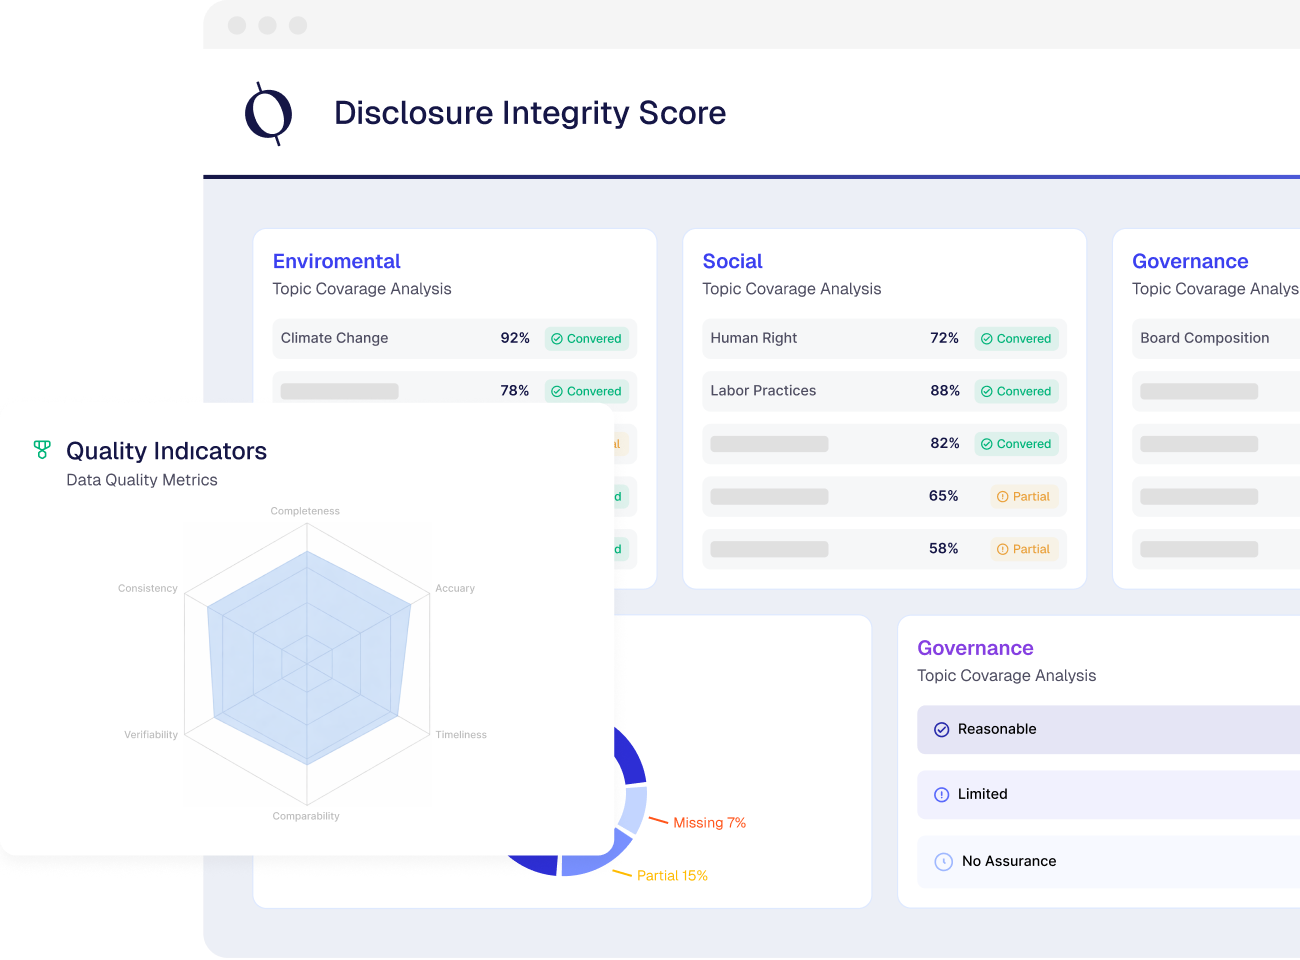
Disclosure Integrity Score
Disclosure Integrity Score is the core Cindeks™ score that measures the quality of your company’s ESG disclosures and its level of alignment with relevant standards.

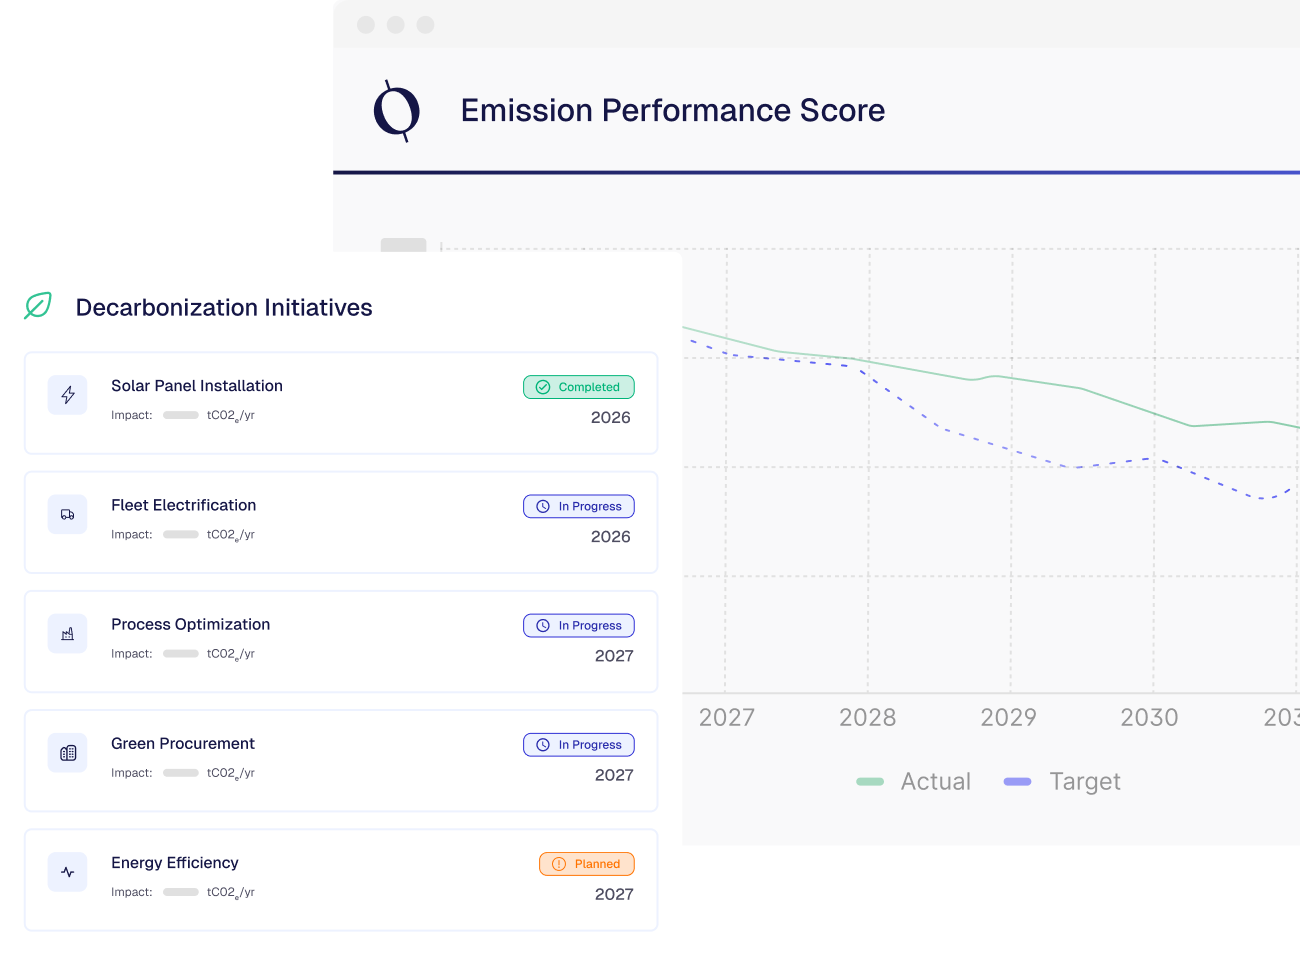
Emission Performance Score
Emission Performance Score is the core Cindeks™ score that reflects your company’s carbon emissions performance and the strength of its emissions reduction strategy.
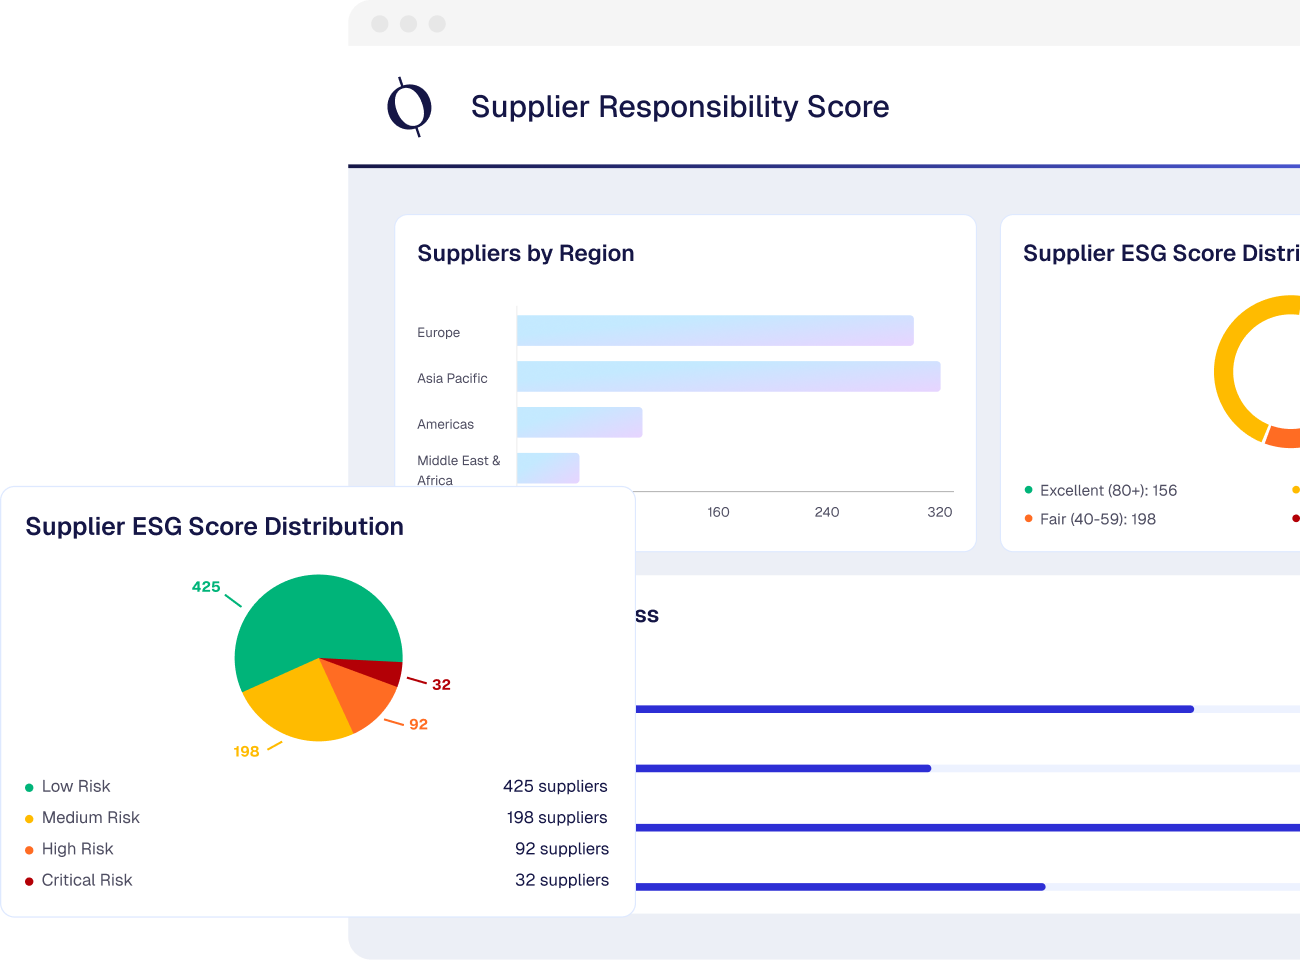
Supplier Responsibility Score
Supplier Responsibility Score is the core Cindeks™ score that reflects your suppliers’ ESG responsibility and level of carbon and data readiness.
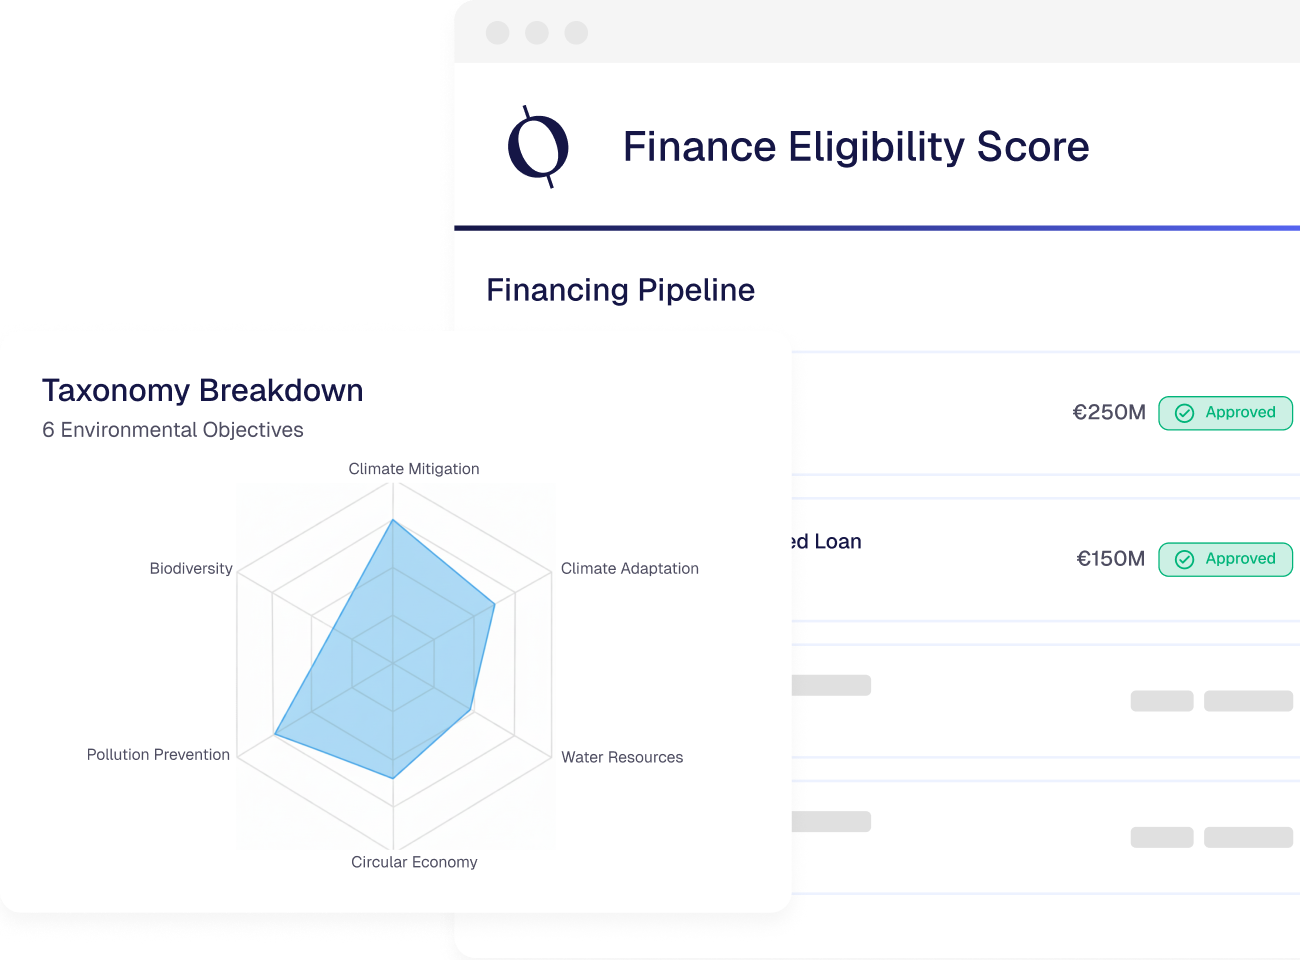
Finance Eligibility Score
Finance Eligibility Score is the core Cindeks™ score that reflects a company’s or project’s eligibility and readiness to access green financing.
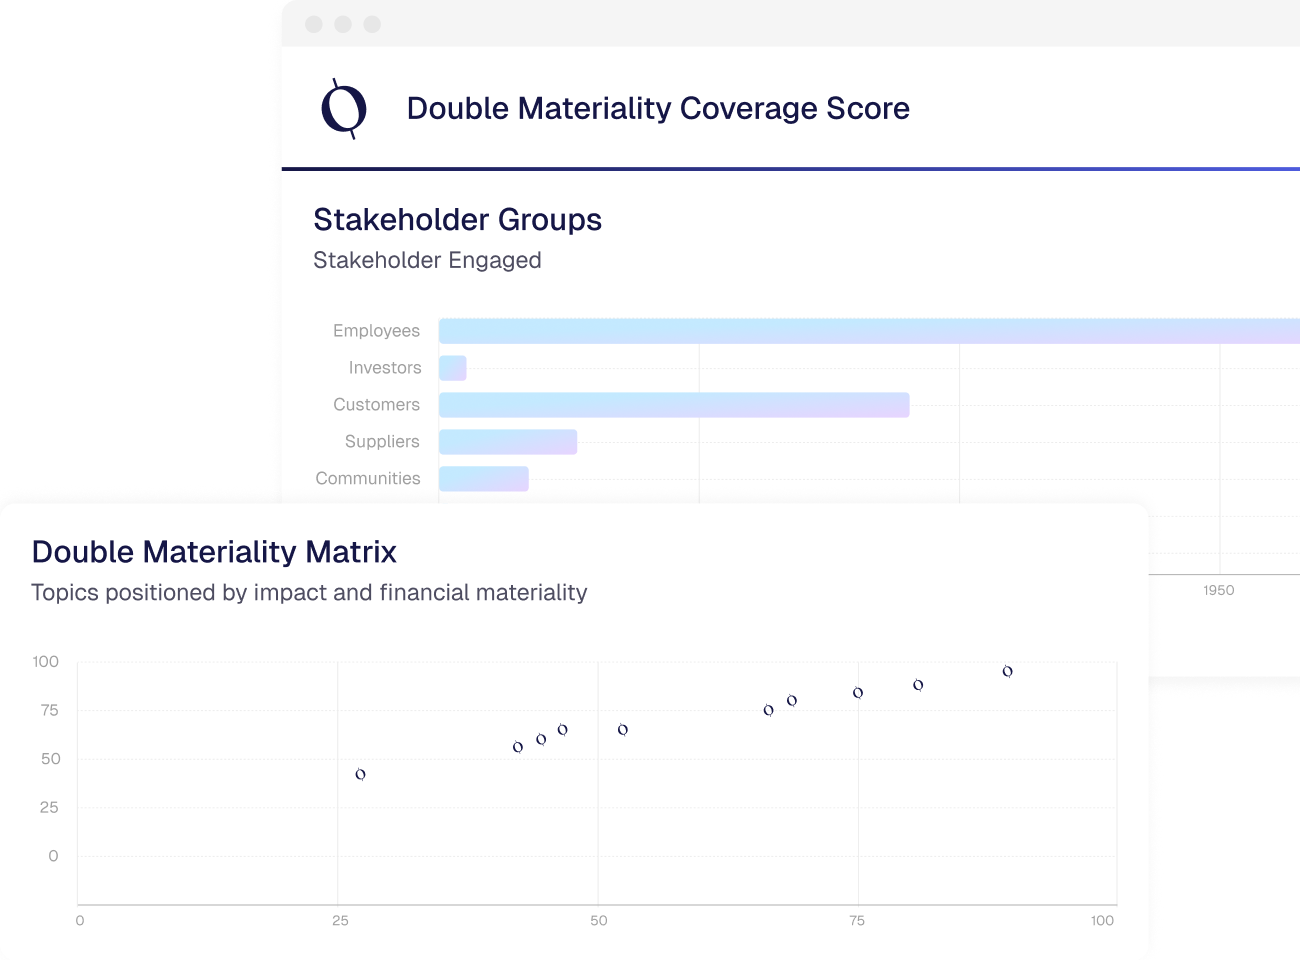
Double Materiality Coverage Score
Double Materiality Coverage Score is Cindeks™'s core score that shows how comprehensively your company conducts its double materiality analysis and how well it complies with ESRS requirements.
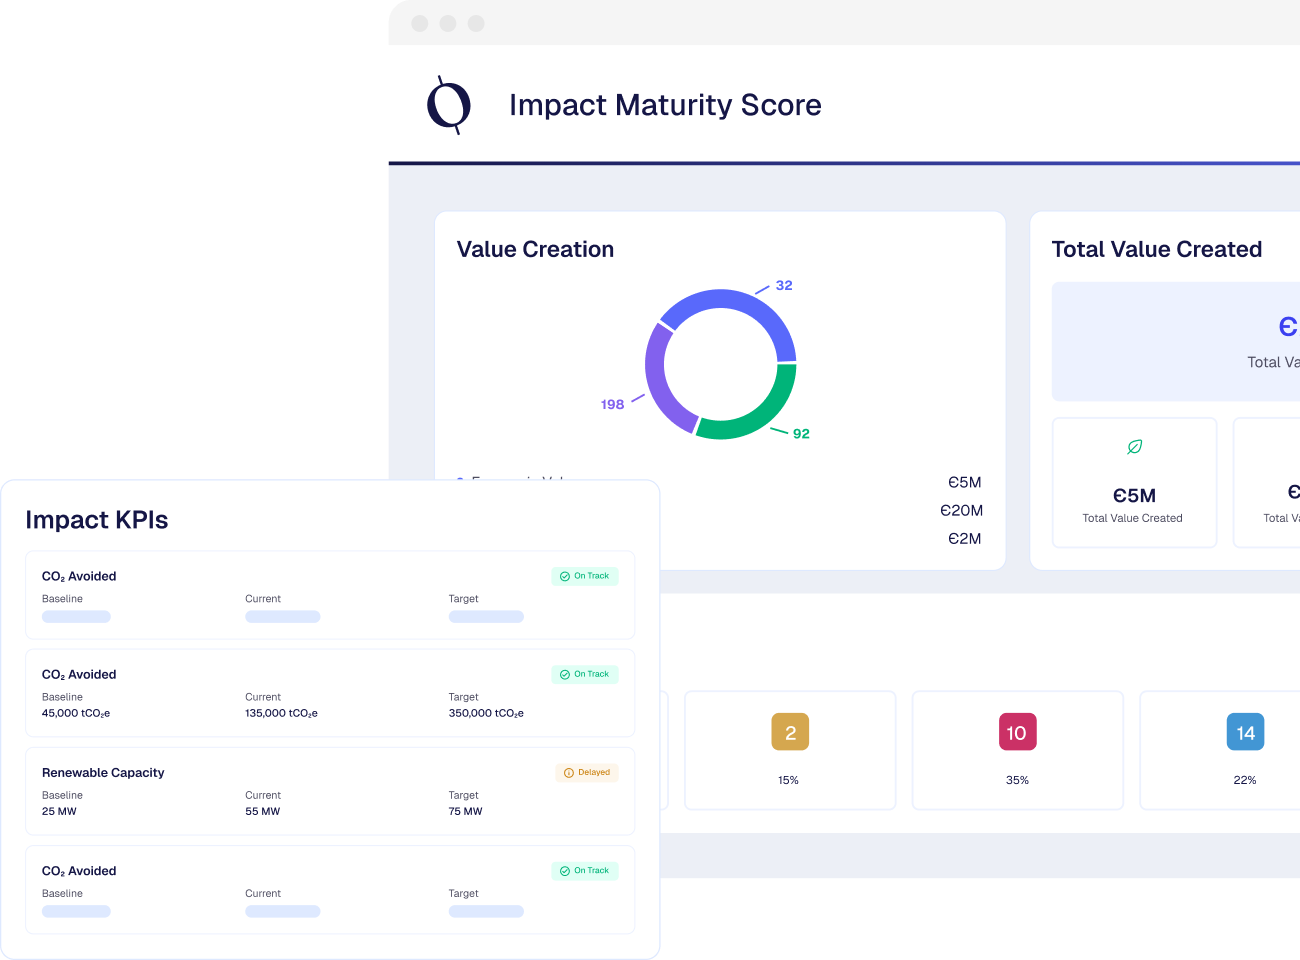
Impact Maturity Score
Impact Maturity Score is Cindeks™'s core score that shows how strongly and measurably a company or project demonstrates its actual sustainability impact.
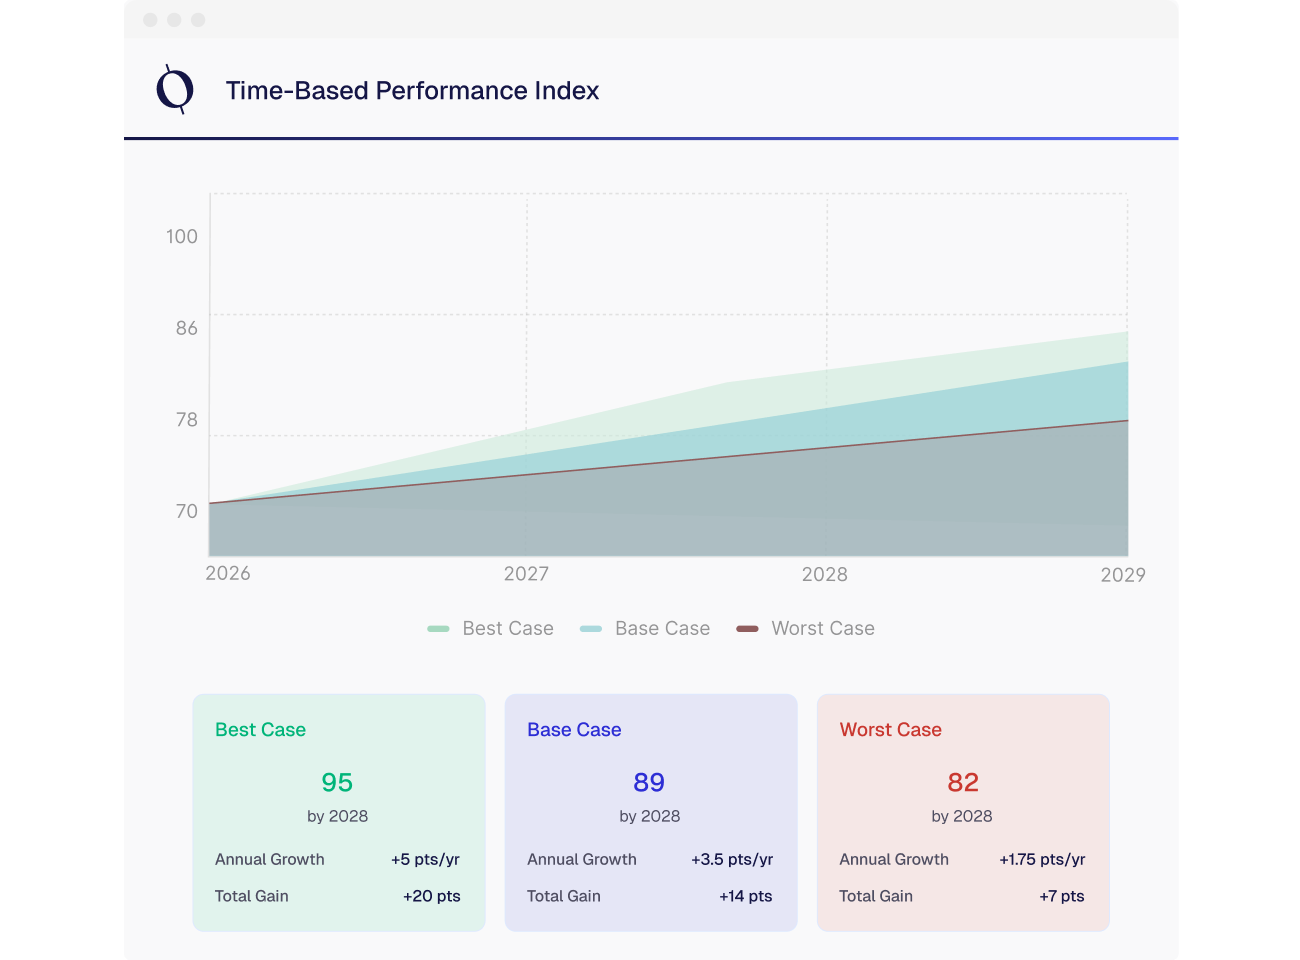
Time-Based Performance Index
Time-Based Performance Index is a trend indicator that shows how all your scores within Cindeks™ change over time.
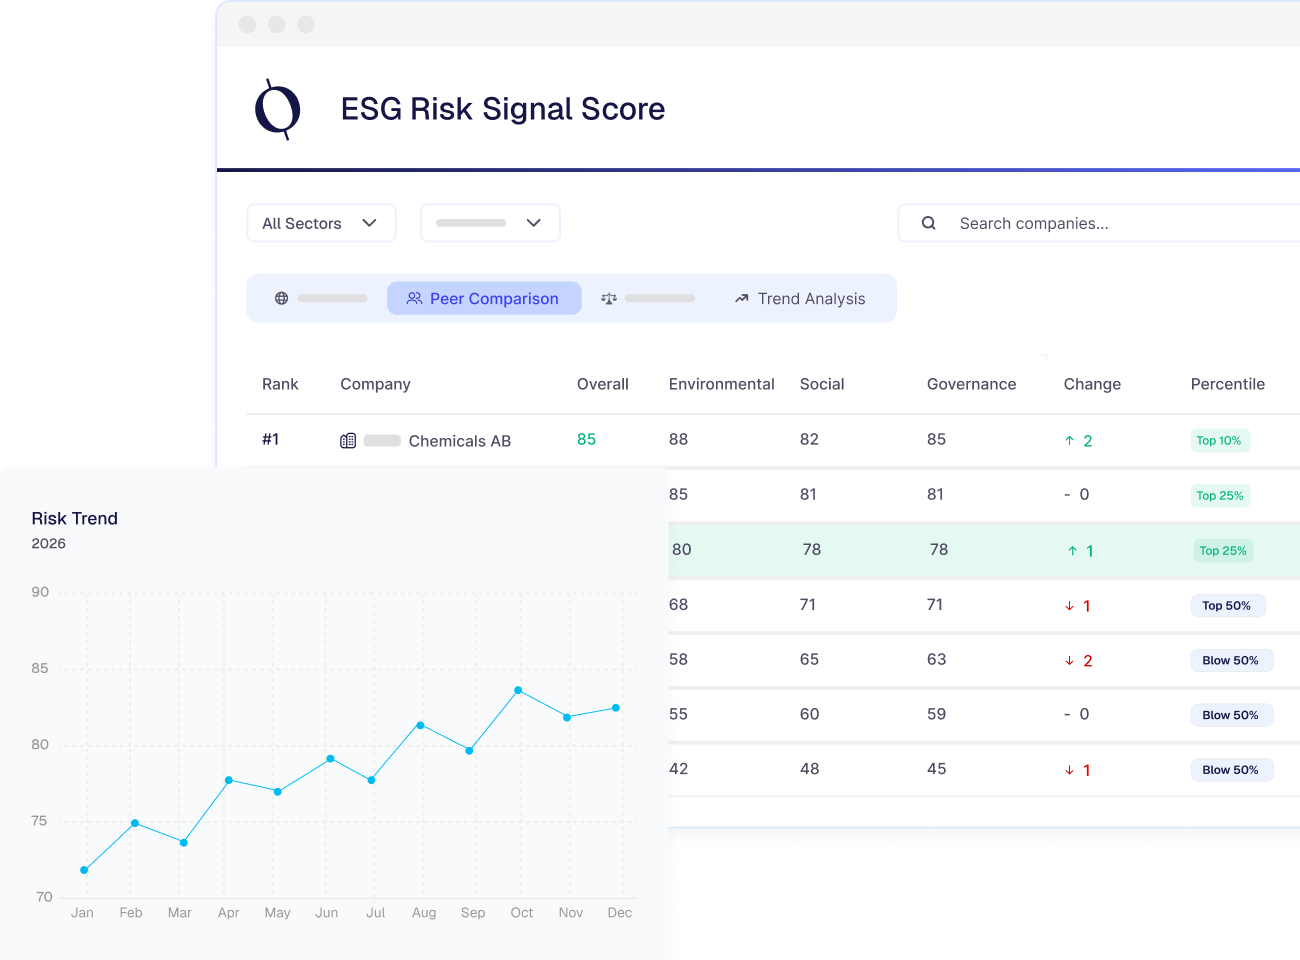
ESG Risk Signal Score
ESG Risk Signal Score is a Cindeks™ score that combines alerts from all products within Carbonance to summarize your company's ESG risk and non-compliance signals in a single indicator.